Power Modeling and Estimation in Early System Design, Part 2
June 28, 2021
Story
In Part 1 of this two-part series we addressed the need for early-stage power analysis in complex SoCs and system designs, and introduced the VisualSim graphical modeling tool as a comprehensive energy simulation solution. In Part 2, we show how VisualSim performs when forecasting and expressing power values across several scenarios (offset concurrent tasks; comparing a single core at 1 GHz to four cores at 250 MHz; dynamic voltage frequency scaling (DVFS); and power gating) in a multicore embedded environment.
The change to a new state can be starting a new execution, moving to deep sleep after a period of inactivity, executing a low-priority versus high-priority use case, and specific conditions such as memory Activate and Refresh. The power expression value must change in tandem with the timing attributes such as clock speed and temperature.
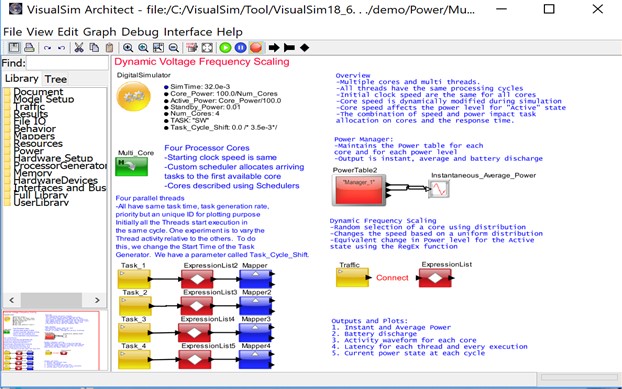
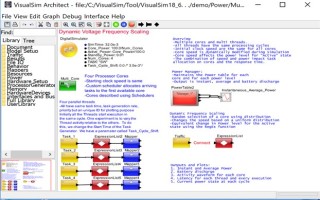
System-level power exploration can evaluate the merits and energy saved by various power reduction and low-power techniques. Here we discuss the techniques and explain their impact using a simulation model in VisualSim. For the purpose of this study, we are using a four-core processor, dispatcher in place of an RTOS, four concurrent threads, and interrupts that are sequenced to trigger the threads on the processing resources. We have parameterized the model for variable clock speeds at the cores, variable numbers of cores between one and four, and an offset between the thread triggering. In addition, we have incorporated logic for dynamic change in the voltage and clock speed.
The block diagram associated with this description is shown in Figure 2.
Figure 2. System-level Block diagram of a multi-core architecture and four concurrent threads
The following experiments are conducted and we look at the latency and power consumption for each scenario.
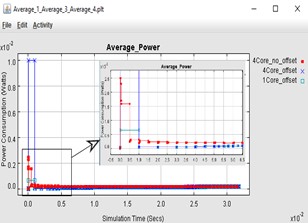
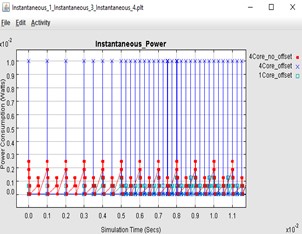
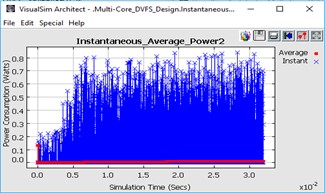
- Offset Concurrent Tasks: There are four tasks, and by default, these tasks are triggered at the same time. In this experiment, we shift each task by a 3.5 ms. This way the tasks do not all start at the same time. As we see the results from Figure 3, this approach reduces the power spike. The maximum spike goes from 1.0mW to 7.5mW, a 25% savings. From Figure 4, the latency has definitely reduced from 7ms to 0.5ms, a significant improvement. The interesting deduction from Figure 3 and Table 1 is that all the four cores are no longer utilized and there is only an occasional overlap in tasks requests for processing resources. There is no impact on the average power consumption.
- Comparing a Single Core Running at 1 GHz to Four Cores Running at 250 MHz: In this experiment, we target all the tasks on a single core which is running at 1GHz speed. We use the offsets for the threads. The results from Figure 3 shows there is a significant reduction in both instantaneous and average power. From Figure 4 we can see the latency plot does not have a significant impact. One can see that the peak power is the same as the non-offset value of 1.0mW but the average power is cut in half to 0.15mW. This is because there is considerable wastage of the processing speed.
Figure 3. LHS shows the average power over time/The RHS shows instant power over time
Figure 4. Latency over time

Table 1. Cumulative and Average power for above experiments
The cumulative and average power consumption for one core with offset in tasks is less than the 4 core with and without offset.
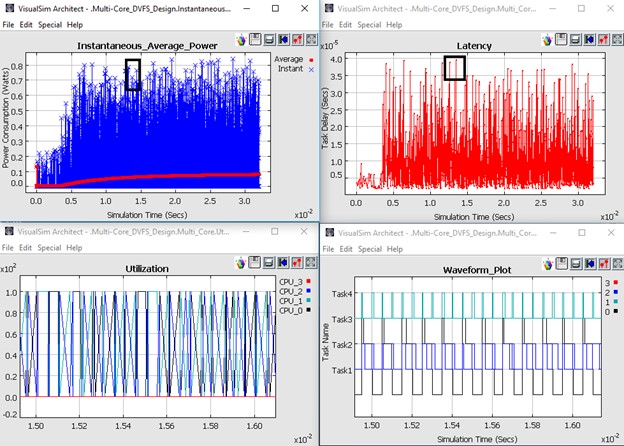
- Dynamic Voltage Frequency Scaling (DVFS): This is the preferred technique to conserve power and is done by varying the clock speeds based on the requirements of the task. A good example is of an x86 processor that is rated for 3.2GHz but runs at 1.8 GHz on the laptop. Using a prototyping board, it is extremely hard to predict the latency of a task when the voltage is frequently adjusted. In the associated model, we have not implemented a specific algorithm and are able to see the change in the power and latency over a wide range of clock speeds. The results are in Figure 5. We are using the four cores and four offset threads for this run. Notice that the power and latency are fluctuating because of variation in clock speed. The latency remained the same as the original offset version. DVFS helps us with large scale power reduction.
From Figure 4 we can see that the time slot for all the tasks are not same, as the incoming tasks increases, the clock speed varies with each core based on the requirements.
Figure 6: Reducing average power by implementing power management
Forcing the cores to move to a standby state after a particular period of time will reduce the power consumption. From Figure 6 we can visualize there is a reduction in power after implementing power management. To extend the DVFS example, it is possible to modify the start and frequency of each task. While analyzing the generated statistics, we can see that the number of cores being utilized reduces (core_3), thus eliminating the extra standby power and reducing the power consumed. As you can see, it is important to explore both the power options and the software dispatch in tandem. This will ensure the required response time while reducing the power consumed.
- Power Gating: This is the process of moving the processing unit to a lower power state after a certain period of inactivity. A common example is the laptop going from Active to Standby to Sleep and Hibernate. In this model we add the power gating state machine logic to the Power Table. We set delay to idle to 10us and the transition time as 1 us. The device stays for a shorter time in the standby state. From Figure 6 we can see that the cores are changing its states from standby to idle whenever the cores are inactive. The transition time has a minimal to zero impact on the latency.
Figure 6: Power Gating where the cores are moved from standby to idle when inactive for 0.1ms with transition time for 1.0us
Conclusion
System-level simulation can be used for extensive power analysis at both the semiconductor and system-level. Using the power exploration in conjunction with the performance studies ensures that the trade-offs are done in tandem, thus ensuring a higher quality product. A number of power studies can be accomplished at the system-level much before product implementation and eliminates all surprises during integration.
A side benefit of this study is that thermal and mechanical engineers get fully validated data, as opposed to approximate best judgment information. Software tools such as VisualSim that have integrated both performance and power analysis into a single system-level model helps construct models faster, reduce model maintenance with smaller set of models, and conduct higher quality exploration early in the design cycle. Also, these system-level tools move the exploration much earlier in the design than was possible previously:
- The implication of offset in each task provides reduction in power consumption and latency
- Reducing the number of cores and increasing the processor speed gives a significant improvements in power reduction
- Varying the clock speed of cores based on the requirement of task provides the best way to reduce the power consumption in the system
- Making the cores idle during inactive periods reduce the wastage of power in the system

