What Triggers Work in Firmware? Uncovering Event-Driven Execution in EDK2
May 18, 2026
Blog
Many people think firmware runs in a simple, step-by-step way. Drivers seem to load one after another, and the execution log shows a smooth boot process. Traditional debugging tools also suggest everything happens in order. However, this view is not always correct.
Although logs make the process look simple, they do not show the real structure behind when and how tasks happen. In reality, firmware execution depends on factors such as dependencies, deferred actions, and changes in system state that are not obvious from the logs.
To better understand this behaviour, the execution of EDK2 firmware was instrumented and analysed using a combination of timestamped logs and visualisations. By capturing protocol installations, event lifecycle transitions, and driver execution points, it becomes possible to move beyond raw logs and observe how work is actually triggered and scheduled.
The analysis shows that firmware does not always run in order. Instead, it follows a trigger-based model where new tasks start when protocols are ready, and events can delay or schedule work. As a result, activity happens in bursts instead of a steady flow.
In this article, we will look at how firmware execution changes over time and offer a clearer way to understand what drives work in EDK2.
Experimental Setup
We studied firmware execution by running experiments with the OVMF package in EDK2, using a QEMU virtual environment. This setup lets us observe firmware behavior during boot in a controlled and repeatable way.
We added instrumentation to the pre-EFI (PEI) and driver execution (DXE) phases to capture key execution events. The system was updated to log the following:
- Protocol installations, which show when new services or interfaces become available.
- Event lifecycle transitions, such as creation, signalling, and callback execution.
- Driver execution paths, showing when each component starts running
Each log entry included a timestamp, so we could match all activity to a single timeline. We exported the data within a structured format and used it to create visualizations. These included an execution timeline, a histogram of event activity, and a frequency analysis of protocol installations. Together, these visuals help show how execution is spread out and what affects its progress.
We ran the experiments several times to make sure the recorded patterns were consistent. While small timing differences were expected, the main execution structure, including activity clusters and links between triggers, stayed the same in each run.
This instrumentation and analysis framework is the foundation for the findings and conclusions discussed next.
Observing Execution: From Events to Behavior
After the firmware instrumentation was in place, the next step was to move beyond raw logs and examine its execution over time. For this, protocol installations, event lifecycle transitions, and driver execution points were visualised along a unified timeline. This approach provided a clearer understanding of the boot process structure.
At first glance, firmware appears to execute sequentially. The system loads drivers one after another, and the log output represents a linear progression of activity. However, plotting these events against time reveals a different pattern.
.png)
Figure 1: Unified timeline of protocol installations, event activity, and driver execution
It is observed that execution activity is not uniformly distributed. Instead, it occurs in distinct clusters. These clusters include bursts of event signalling and callback execution. They are often followed by groups of driver initialisations. Between these spikes, there are quieter regions with minimal observable activity. This behaviour suggests firmware execution progresses in phases rather than as a continuous operation.
To confirm this observation, a histogram of event execution density was generated. The resulting distribution displays clear peaks. This shows that much of the event-driven work concentrates on specific boot intervals. Execution is grouped into phases of heightened activity. This supports the notion of a phased execution model.
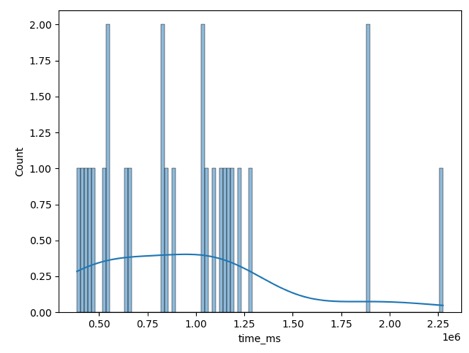
Figure 2: Distribution of event execution over time showing clustered activity
Observing protocol installations adds context to these clusters. Some protocols appear several times across the timeline, linked to different handles or system components being initialised. These repeated installations often coincide with regions of increased event and driver activity. This indicates protocol availability plays a key role in enabling or triggering later execution.
Thus, the three observations suggest firmware execution is not strictly linear. Instead, it is shaped by triggers and deferred operations. Protocol availability and event-driven mechanisms decide when work is performed. This underlying structure is not apparent from logs alone. It becomes clear only when execution is visualised and analysed over time.
Understanding Event-Driven Execution:
To see why execution seems clustered, we should look at how work is scheduled during the driver execution phase. EDK2 uses an event-driven model, so work is often delayed and runs asynchronously, unlike in a traditional sequential system.
Each event goes through a set process: it is created, signalled, added to a queue, and then eventually executed. The work happens when the event’s notification callback runs. This means there is a gap between when a condition is met and when the work actually happens.
Data shows that events are often signalled at one time but executed later, which causes delays in the queue. Sometimes, several events build up before they are processed, so callbacks run in bursts when the system starts handling them.
This delayed execution model explains why execution looks clustered on the timeline. The firmware waits and collects pending tasks, then processes them in groups. As a result, execution happens in bursts instead of a steady flow.
Knowing this lifecycle is important when you analyze firmware behavior. If you do not consider event-driven execution, you might misunderstand delays or think work happens in order, when it is actually being delayed and scheduled for later.
Protocols as Execution Triggers:
Events decide how work gets done, while protocols decide when work can start. In EDK2, protocols show when services or hardware interfaces are available. Installing a protocol often triggers the next steps in the process.
The same protocol GUID can show up several times during the boot process. This does not mean it is duplicated. Instead, it happens because the firmware installs the same protocol on different handles as it finds and sets up new devices or components.
When a protocol is installed, it can make new dependencies possible. Drivers that need a certain protocol will stay inactive until it is available. After the protocol is installed, the firmware can start these drivers, which often leads to more events and more drivers running.
It can be observed as a pattern in the execution timeline. Repeated protocol installations often coincide with bursts of event signalling and driver initialisation. This shows that protocol availability is a main way to trigger further work.
.png)
Figure 3: Frequency of protocol installations across the boot process
Protocol installation is not just a one-time setup. It is an ongoing process that gradually opens up new execution paths. This shows that firmware execution changes as the system state shifts during boot.
Putting It Together: A Trigger-Driven Model:
When viewed together, the roles of events and protocols reveal a different model of firmware execution rather than what logs alone would suggest.
Instead of a strictly linear sequence, execution is driven by a combination of dependency resolution and deferred work. Protocol installations make new capabilities available, which in turn enable drivers and trigger events. These events are queued and later dispatched, resulting in bursts of execution that appear clustered in time.
It can be summarised as a trigger-driven model where:
- Protocol availability enables new work.
- Events defer and schedule that work.
- Drivers execute once dependencies are satisfied.
Under this model, execution is not simply a matter of progressing from one step to the next. Instead, it is shaped by when conditions are met and how work gets scheduled. This results in a structured, but non-uniform behaviour.
This perspective provides a more accurate mental model for understanding firmware behaviour. It also explains why execution patterns may appear inconsistent or clustered when viewed through timing-based analysis.
Engineering Implications:
Seeing firmware as a trigger-driven system has some practical effects for engineers who use EDK2.
First, it changes how engineers look at performance. Boot delays are not always due to slow parts, but can happen because work is waiting in event queues. To spot these delays, you need to see both the event lifecycle and how things are scheduled.
Second, debugging gets more complex. Work can be triggered in less direct ways, like when a protocol is installed or an event is signaled. This means the real cause of a problem might not be right next to the failure you see in the logs. Engineers need to look at the whole chain of dependencies that led to what happened.
Third, instrumentation becomes essential. Traditional log-based approaches can obscure the execution's underlying structure. By capturing timestamps and visualising activity, it becomes possible to identify clusters, dependencies, and trigger points that would otherwise remain hidden.
Finally, this way of thinking shows why system state matters. Firmware behavior changes depending on when protocols are available and how events are scheduled. Even small changes in setup can affect how things run in ways that are not always obvious.
Conclusion:
Many people think EDK2 firmware runs in a straight line, but it is actually more complex. When you look at protocol installations, event lifecycles, and driver executions, you see that work happens in bursts, triggered by certain events and delayed scheduling.
Events add a way to queue work and run it later, while protocols decide when new execution paths can start. This means the system runs based on dependencies and timing, not just a set order of steps.
This trigger-based model gives a clearer way to understand how firmware works. It also helps with debugging, performance checks, and system design, making it easier for engineers to see how and when work happens during boot.
Swastik Ghosh is a firmware engineer with experience in low-level system software, embedded systems, and platform initialization. His work spans EDK2 firmware, RTOS-based systems, and bare-metal development, with a focus on firmware optimization and execution analysis. He holds an M.S. in Computer Engineering from North Carolina State University.

Swastik Ghosh is a firmware engineer with experience in low-level system software, embedded systems, and platform initialization. His work spans EDK2 firmware, RTOS-based systems, and bare-metal development, with a focus on firmware optimization and execution analysis. He holds an M.S. in Computer Engineering from North Carolina State University.